The MySQL server at the SysCrunch server was always being killed, the reason was due to lack of resources (RAM). Even after a memory increase to a total of 3+ GB, the problem persisted.
This blog post describes how to set up a monitoring tool (Monit) under CentOS 6 to monitor processes and to restart them when necessary. It also explains how to avoid the Apache server from exhausting the memory.
The problem
Essentially, the Apache server was consuming most of the RAM leaving little for other processes. Thus, MySQL was eventually killed as well as the ElasticSearch service. This happened as the number of web services and websites in the server increased. This would manifest when bots like googlebot started scanning intensively the server. Yes, Apache and MySQL are running in the same server with the current configuration.
Monit
The steps to install the monitoring tool Monit under CentOS 6 are similar to other service like Apache, you can also follow this tutorial or this one (Monit part) if you are under CentOS 7 and this might help for Ubuntu.
Install Monit
sudo yum install monit
Monit Web Interface
First open the configuration file, you can also use the nano editor.
sudo vi /etc/monit.conf
Find the set httpd port line, uncomment and update the configuration, here is a sample configuration:
set httpd port 2812 and
    use address 192.192.192.192  # Your IP address (private/public) for connections.
    allow 0.0.0.0/0.0.0.0        # What networks are allowed? Any network.
    allow admin:password         # Set username and password
    allow @monit # allow users of group 'monit' to connect
    allow @users readonly # allow users of group 'users' to connect readonly
Add monit to the system startup:
sudo chkconfig monit on
Start the monit service:
sudo service monit start
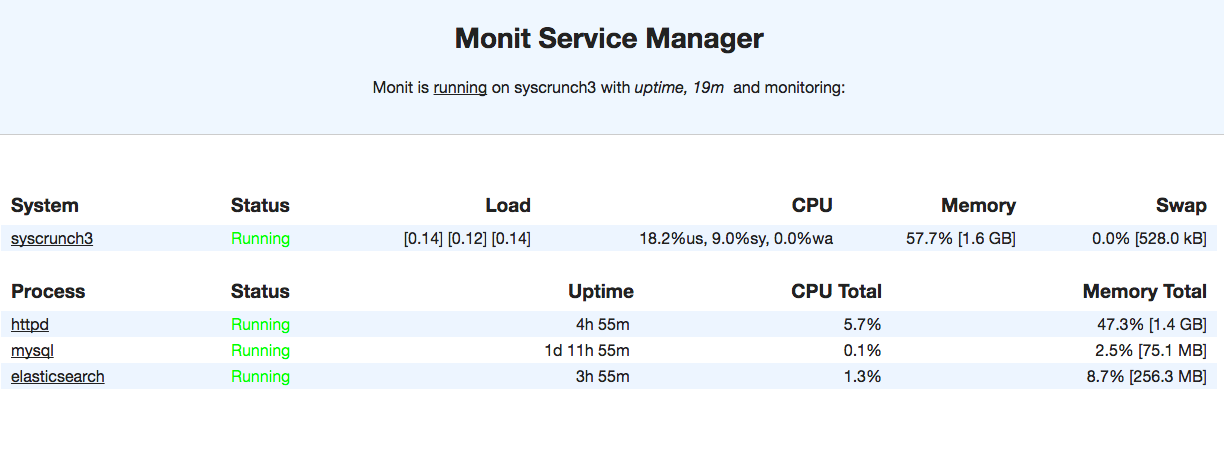
You can test the web interface in a browser using the provided IP address or hostname (e.g. http://192.192.192.192:8912 or http://hostname.com:8912). It will ask your for the username and password you have defined in the config file.
This is a sample capture of our server web interface:
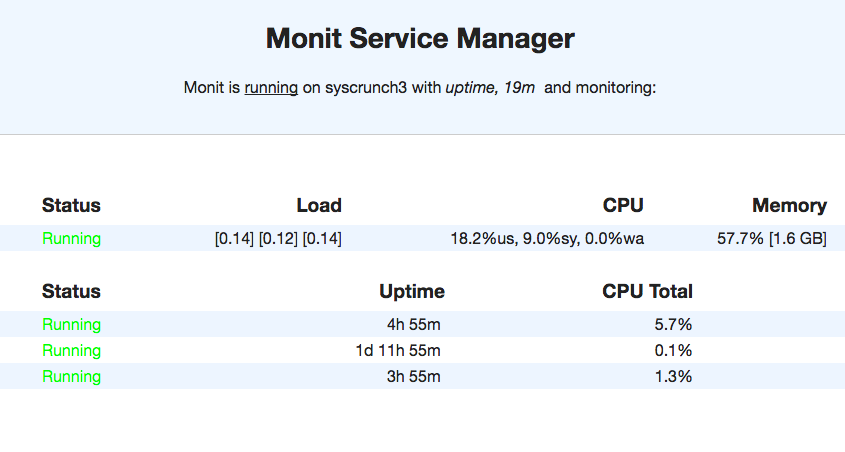
Monit Monitoring
Monit can monitor multiple processes and execute actions based on some conditions like CPU and memory usage.
Apache Web Server
The paths might be different in your system, make sure to check them before. Find and uncomment the process httpd line, this is a sample config:
check process httpd with pidfile /var/run/httpd/httpd.pid
    start program = "/etc/init.d/httpd start" with timeout 60 seconds
    stop program  = "/etc/init.d/httpd stop"
    if cpu > 70% for 2 cycles then alert
    if cpu > 80% for 5 cycles then restart
    if totalmem > 1500.0 MB for 5 cycles then restart
    if children > 250 then restart
Essentially, the Apache server cannot take more than 1.5 GB, if it reaches that limit at least during 5 cycles, it gets restarted to free resources. The same happens if too many workers (250) are created. These values depend heavily on your system resources and the number of processes you are running.
MySQL Server
The default monit config file does not include a sample for MySQL. Following the Apache configuration and some samples from stack overflow, this is a proposed config that you can add after the Apache config:
check process mysql with pidfile /var/run/mysqld/mysqld.pid
  group mysql
  start program = "/etc/init.d/mysqld start"
  stop program = "/etc/init.d/mysqld stop"
  if failed host 127.0.0.1 port 3306 then alert
  if failed host 127.0.0.1 port 3306 then restart
  if 5 restarts within 5 cycles then timeout
If the server does not respond on port 3306, it raises an alert first and then does a restart. If too many restarts happen within a short period (5) then it timeouts.
ElasticSearch
Similar to the MySQL config, this is a proposed configuration that you can put after the Apache or MySQL configs.
check process elasticsearch with pidfile /var/run/elasticsearch/elasticsearch.pid
  start program = "/etc/init.d/elasticsearch start"
  stop program = "/etc/init.d/elasticsearch stop"
  if failed host 127.0.0.1 port 9200 then alert
  if failed host 127.0.0.1 port 9200 protocol http then restart
  if 5 restarts within 5 cycles then timeout
I haven’t seen any alerts or restarts of this service yet. Notice the protocol http condition for the restart, it might be necessary as ElasticSearch runs as a http application on that port.
Configuring Alerts
Monit lets you configure alerts by e-mail, in this case we use gmail as SMTP and you can also default to localhost to deliver the e-mails. You can refer to the Monit documentation for more details.
Find and uncomment the set mailserver line to ressemble to:
set mailserver smtp.gmail.com PORT 587 USERNAME "your-user@gmail.com" PASSWORD "your-password" using TLSV1 with timeout 30 seconds
You have to replace the username and password. You can then find the set alert line to define the recipient:
set alert dummy@syscrunch.com not on { instance, action }
This alert is skipping Monit actions like start, stop or performing user actions in order to avoid trivial cases.
IMPORTANT: Gmail will not send e-mails with this configuration unless you enable the less secured Apps option for your account at http://www.google.com/settings/security/lesssecureapps.
Apache Server RAM Solution
After monitoring the processes with Monit, the problem was with the Apache server that was running too many worker instances. This would lead to exhausting the system memory and lead to other processes being killed. The issue is that most of the web services (virtual hosts) were configured with a HTTP Keep Alive header, this allows for faster response times but it consumes more resources as the connection is kept open.
The solution was to remove the Header set Connection keep-alive from the virtual hosts. It can also be set explicitly to close Header set Connection close. Alternatively there are other options to tune the persistent connections like MaxKeepAliveRequests and KeepAliveTimeout , it’s recommended to have a good understanding since for HTTP 1.1 clients, the default option is to keep connections alive, you can read more in the Apache docs for Keep Alive.
In the end with this configuration, it was possible to launch 3000 thousand requests with 60 concurrent requests using Apache Benchmark (3 parallel calls) and the server handled it without any problems. Here is a sample output of one of the tests:
Server Hostname:        www.syscrunch.com
Server Port:            80

Document Path:          /
Document Length:        47998 bytes

Concurrency Level:      20
Time taken for tests:   122.177 seconds
Complete requests:      1000
Failed requests:        0
Total transferred:      48396000 bytes
HTML transferred:       47998000 bytes
Requests per second:    8.18 [#/sec] (mean)
Time per request:       2443.541 [ms] (mean)
Time per request:       122.177 [ms] (mean, across all concurrent requests)
Transfer rate:          386.83 [Kbytes/sec] received

Connection Times (ms)
              min  mean[+/-sd] median   max
Connect:       55  139  93.7    113     973
Processing:   320 2278 594.2   2249    8164
Waiting:      188 2011 601.7   1987    8009
Total:        380 2417 594.7   2375    8336

Percentage of the requests served within a certain time (ms)
  50%   2375
  66%   2481
  75%   2562
  80%   2616
  90%   2855
  95%   3265
  98%   4264
  99%   4564
 100%   8336 (longest request)
I wrote this article to document the solution to this problem and it might be updated over time.
Hope it’s useful for some other people.